What Is Mean Radius, And How Do You Use It?
We talk about shot groups all the time. We brag about a ½ inch group at 100 yards with our most beloved precision rifle, but what are we actually talking about when we talk about shot grouping? Are shot groups the best way to measure accuracy, or is there something that is more statistically valid we can use?
When we measure the shot grouping on our target, we typically measure extreme spread. This is usually the distance between the centers of the two most distant holes in the group of shots on the target. At first glance, this seems like a good way to measure accuracy. I mean, we shoot the target, we measure the results. Seems simple, right?
Extreme Spread vs Mean Radius
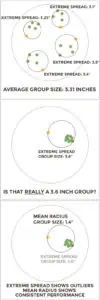
However, the problem with this technique is what we are really measuring is the distance between the two worst shots of a group. We’re judging our performance by how bad we are at one moment, not our consistent performance. However, we can gain some idea of how we perform consistently by shooting a number of groups and then averaging them together. The problem is, we have to shoot a fair amount of ammo to get a good representation of our actual accuracy results.
For instance, in the past, when we test a gun here at Ammoman, we shoot four groups of five rounds each and then average them together. Sounds good, right? That’s 20 shots, it should tell us how accurate the gun is, right? The problem is that in reality, we are only measuring eight shots: The worst two shots out of each of those five round groups. We need a way of measuring shot grouping that measures every shot we take, not just the worst two of each group we shot.
Let’s Get Mean (Radius)
 Enter mean radius. This gets complicated to determine, because you need to find the mathematical center of the group you shot. Then you measure the distance of each individual shot from the mathematical center and average those distances together. With mean radius, we are still averaging shots together. The difference is, we are measuring the distance from each shot to every other shot, not just the two worst shots from each group. When we use mean radius to measure our shot grouping, all the shots matter in the group, not just the two worst ones.
But why bother, you say? For one thing, the U.S. Military has been using mean radius to evaluate the performance of their rifles for quite some time now, going back at least as far as the early 20th century and the trials for the M1903 Springfield rifle.
So I guess it works.
Mean Radius Means Lots Of Math
However, measuring mean radius requires a lot of mathematical heavy lifting. Fortunately for all of us, today’s computers can do that lifting for us. That is why we are rolling out the Ammoman Shot Group Analyzer. This handy online tool will allow you to upload a photo of your target, set the target size, measure both the extreme spread of your group and the mean radius, and then save your results for later analysis.
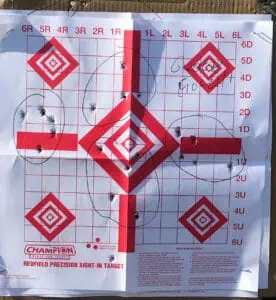
 For example, let’s look at a series of groups from a recent 1911 versus Glock test. These four groups of Fiocchi 115 grain 9mm FMJ were shot at a distance of 15 yards using a stock Glock 19. Let’s compare the results of measuring extreme spread versus mean radius.
At first glance, the group on the left-hand side of the target appears significantly smaller than the other three groups. What that group size is measuring, however, is the distance between the two worst shots in that string of fire. Once we start to look at the mean radius of each group, a different story appears.
| Shot Group 1 Extreme Spread 2.05 in Mean Radius 1.99 in | Shot Group 2 Extreme Spread 3.5 in Mean Radius 3.15 in | Shot Group 3 Extreme Spread 3.19 in Mean Radius 2.27 in | Shot Group 4 Extreme Spread 2.75 in Mean Radius 2.01 in |
Using extreme spread to measure groups does work, but it requires more effort (and more ammo) to achieve statistically significant results.
Save Range Time, Save Ammo
With extreme spread, you get one data point for every group you shoot. However, by using mean radius to measure groups, you now have one data point for every shot you take. This greatly speeds up the process of gathering data on the performance of your gun and ammunition. Using the Ammoman Shot Group Analyzer, you no longer need to shoot four or more five shot groups to get an idea of the capabilities of your gear. Because the Shot Group Analyzer uses mean radius to measure the distance between each shot on the target, you can get statistically significant information with much less ammo.
Extreme spread gives you an idea of what your worst-case performance might look like. It’s also easier to measure, and so that’s what we use. However, now that it’s fast and easy to measure your groups with the Ammoman Shot Group Analyzer, you can quickly assess the down-range performance of your gear with a minimal use of your precious ammo supply, leaving you with better feedback about your shooting so you can maximize your potential with each trip to the range.


